Strategic Framework for Reducing Costs While Maintaining Service Quality and Building Competitive Advantage
Vietnamese exporters face a persistent dilemma: logistics costs typically consume 10-20% of product value for international shipments, yet cutting costs aggressively risks service failures that damage customer relationships and market position. The electronics manufacturer who saves 15% on freight rates by switching to the cheapest carrier discovers why they were cheapest when containers arrive three weeks late and customers cancel future orders. The furniture exporter who eliminates packaging materials to reduce costs pays far more in damage claims and replacements. The garment manufacturer who consolidates shipments excessively watches customers defect to competitors offering more frequent deliveries.
Effective cost optimization requires nuance and sophistication. You’re not simply minimizing expenses—you’re maximizing value, balancing cost reduction against service quality, reliability, speed, and strategic objectives. The most successful Vietnamese exporters approach logistics costs strategically: they understand their complete cost structure in detail, negotiate professionally with carriers and service providers, implement operational efficiencies systematically, leverage technology intelligently, and maintain continuous improvement disciplines. The result isn’t just lower costs—it’s sustainable competitive advantage through superior cost-to-serve economics that enable growth.

Critical Advisory:Logistics cost optimization, carrier negotiations, contract terms, consolidation strategies, and financial planning involve complex operational, commercial, legal, and strategic considerations specific to products, shipping patterns, volumes, routes, service requirements, and business models. Cost optimization strategies must balance cost reduction with service quality, reliability, risk management, and strategic objectives.
This guide provides general frameworks current as of November 2025. Poorly executed cost cutting can result in service failures, customer dissatisfaction, damaged relationships, compliance issues, and ultimately greater costs than the original “savings.” Carrier contracts and logistics service agreements have significant business and legal implications requiring careful review and professional guidance.
We strongly recommend consulting with logistics consultants, freight forwarders, supply chain advisors, and financial advisorsfor comprehensive cost analysis, optimization strategy development, carrier negotiations, and implementation planning specific to your business circumstances and objectives. Last updated: November 2025
Why Strategic Cost Optimization Creates Competitive Advantage
The difference between cost cutting and cost optimization seems semantic but matters profoundly. Cost cutting focuses on reducing expenses, often without adequate consideration of impacts on service, quality, or strategic position. Cost optimization focuses on maximizing value—achieving the best possible outcomes at the most economical cost, recognizing that cheapest isn’t always best and that intelligent spending often saves money. Vietnamese textile exporters who optimize consolidation strategies might actually increase total freight spending slightly but reduce per-unit costs substantially while maintaining delivery reliability. That’s optimization. Slashing freight budgets arbitrarily and forcing operations to use the cheapest carriers regardless of service? That’s cutting—and usually backfires.
Strategic cost optimization creates competitive advantages beyond immediate expense reduction. You improve profitability directly through lower logistics costs. You enhance competitive positioning by offering lower prices or better margins than competitors who haven’t optimized as effectively. You free up capital for strategic investments—new markets, product development, capacity expansion. You build organizational capabilities in analytical rigor, process improvement, and operational excellence that deliver value across your entire business. And perhaps most importantly, you gain flexibility—lean operations weather market volatility and competitive pressure far better than bloated cost structures.
The Vietnamese Exporter Cost Context
Vietnamese exporters face particular cost pressures given geographic and competitive realities. Distance to major markets (US, Europe) creates substantial transportation costs—ocean freight from Vietnam to US East Coast typically costs $2,000-$4,000 per FEU depending on market conditions, representing significant expense for many products. Competition from regional exporters (China, Bangladesh, Thailand) often comes down to pennies per unit, making cost efficiency critical. And many Vietnamese exporters operate on thin margins where small percentage improvements in logistics costs translate to meaningful profitability improvements.
But Vietnamese exporters also benefit from improving cost optimization opportunities. Vietnam’s expanding logistics infrastructure creates new routing options and competitive service provider market. Growing export volumes provide negotiating leverage with carriers and forwarders. And Vietnam’s extensive FTA network enables duty optimization complementing logistics cost management. The challenge is capturing these opportunities systematically rather than managing logistics costs reactively.
Comprehensive Cost Analysis: Understanding Your Baseline
You can’t optimize what you don’t measure. Effective cost optimization starts with comprehensive understanding of your complete logistics cost structure—not just obvious freight charges but all the costs embedded in getting products from your factory to customers’ hands. Most Vietnamese exporters track ocean or air freight rates carefully but underestimate or miss entirely the dozens of other charges that accumulate: origin handling, destination charges, customs fees, storage, insurance, packaging, documentation, and various surcharges that can collectively equal or exceed base freight rates.
Total landed cost analysis provides the framework for understanding complete costs. For a Vietnamese furniture shipment to US customer, total landed cost includes: product cost, inland trucking from factory to port, container loading fees, export customs clearance, ocean freight, bunker and currency surcharges, destination port charges, US customs clearance and broker fees, import duties, inland delivery to customer, packaging materials, cargo insurance, and financing costs for the capital tied up during transit. Until you understand and quantify all these components, optimization attempts remain superficial.
Cost Component Mapping: Where Money Actually Goes
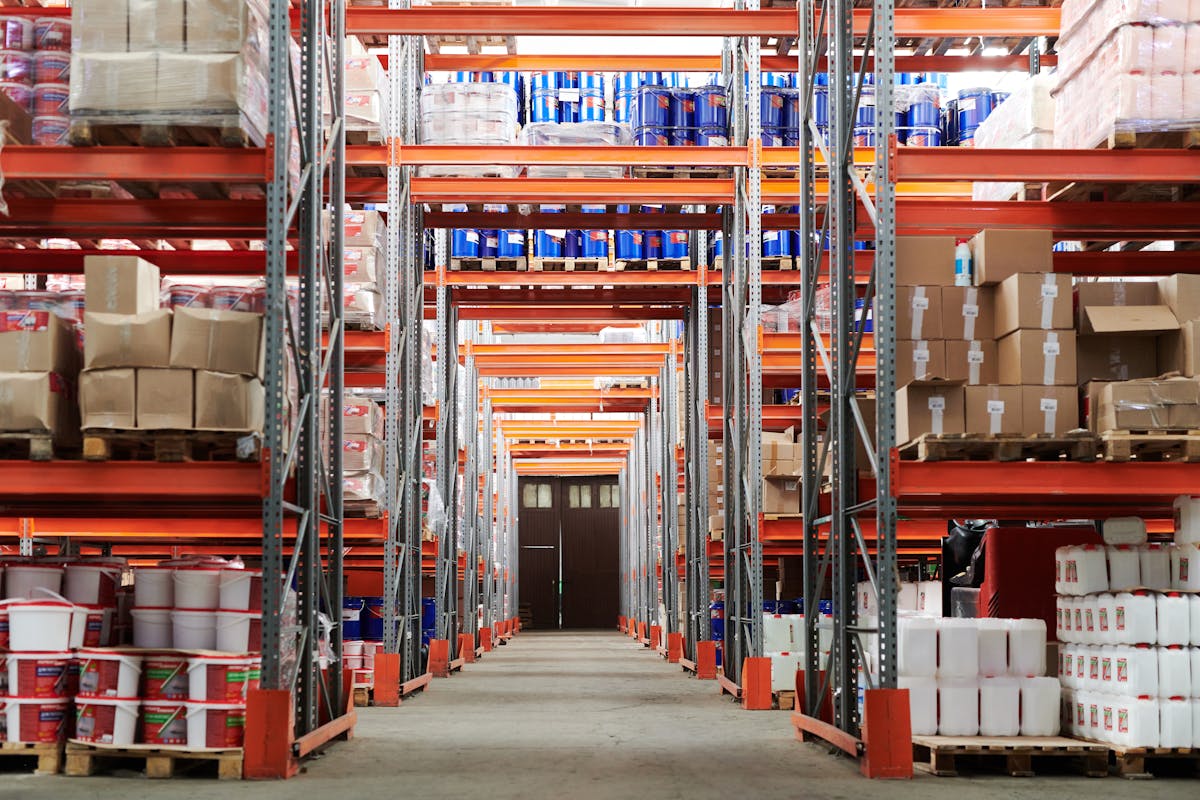
Break down your logistics costs into granular categories enabling targeted optimization. Transportation typically represents 60-70% of total logistics costs—ocean or air freight plus inland trucking. But within transportation, base rates may be only portion of total: fuel surcharges commonly add 15-30%, peak season surcharges another 10-20% during high-demand periods, and various port congestion or equipment imbalance charges stack on top. Understanding this structure reveals that negotiating base rates alone leaves significant cost drivers unaddressed.
Warehousing and handling represent another 15-25% of logistics costs depending on your distribution model. This includes not just storage fees but receiving, putaway, picking, packing, and loading charges at both origin and destination. For Vietnamese exporters using consolidation warehouses in Vietnam or distribution centers in destination markets, these costs accumulate quickly. Packaging materials, while seemingly minor, often run 3-5% of logistics costs—more for fragile products requiring extensive protective packaging. Insurance, documentation, and compliance costs add another 2-4%. The cumulative effect: seemingly small cost categories collectively matter significantly.
| Cost Category | % of Total Logistics Cost | Key Optimization Levers | Typical Improvement Potential |
|---|---|---|---|
| Ocean/Air Freight Base Rates | 40-50% | Carrier negotiations, volume leverage, route optimization, consolidation | 10-20% through strategic sourcing and volume concentration |
| Surcharges & Fees (fuel, peak season, congestion) |
15-25% | Contract terms limiting surcharges, timing flexibility, carrier selection | 5-15% through contract caps and strategic timing |
| Warehousing & Handling (origin and destination) |
15-25% | Process efficiency, automation, facility optimization, consolidation | 15-30% through operational improvements and technology |
| Customs & Compliance | 5-8% | Broker negotiations, documentation accuracy, FTA utilization, duty optimization | 20-40% through professional management and FTA benefits |
| Packaging & Materials | 3-6% | Right-sizing, material optimization, standardization, reusable packaging | 10-25% through engineering and standardization |
| Insurance & Risk | 1-3% | Program optimization, deductible management, risk reduction initiatives | 10-20% through professional insurance management |
Cost-to-Serve Analysis: Understanding Customer and Product Profitability
Not all customers and products are created equal from logistics cost perspective. A large customer ordering full containers monthly to single destination costs far less to serve per unit than a small customer ordering LCL shipments weekly to multiple addresses. Products that cube out containers before weighing out deliver better freight economics than dense, heavy products. Understanding these differences through cost-to-serve analysis reveals which customers and products drive profitability versus those consuming margin through logistics intensity.
Vietnamese furniture exporters often discover that certain product categories—bulky items like sofas that cube out containers efficiently—deliver substantially better logistics economics than compact, dense items like side tables requiring more shipments for same revenue. This doesn’t necessarily mean eliminating less favorable products, but it should influence pricing, customer discussions about order patterns, and strategic decisions about product mix and market focus. The exporters who understand cost-to-serve can make informed strategic choices; those flying blind often subsidize unprofitable business unknowingly.
Strategic Carrier Negotiations: Beyond Just Rate Shopping
Many Vietnamese exporters approach carrier negotiations transactionally: collect quotes, choose lowest rate, move on. This leaves substantial value on table. Professional carrier negotiation involves strategic relationship development, comprehensive proposal evaluation, sophisticated contract structuring, and ongoing performance management. The difference between transactional and strategic approaches often amounts to 15-25% total cost difference, plus superior service and problem resolution when issues arise.
Building Negotiating Leverage
Negotiating leverage comes primarily from volume concentration—carriers provide better rates and service to customers representing meaningful volume on their networks. Vietnamese exporters shipping 50-100 TEUs annually to US have moderate leverage; those shipping 500+ TEUs have substantial leverage. If your current volumes don’t provide significant leverage individually, consider how to increase it: consolidate volumes currently spread across multiple carriers with 2-3 primary carriers, combine volumes across your company rather than negotiating separately by product line or division, or coordinate with other exporters for group purchasing (industry associations sometimes facilitate this).
Contract length provides additional leverage—carriers prefer longer commitments (2-3 years) enabling their capacity planning. You can trade commitment for better rates, but carefully consider the flexibility trade-off. Market conditions change; locking rates for three years provides budget certainty but means missing opportunities if rates fall. Many sophisticated shippers negotiate hybrid approaches: longer terms with annual rate adjustments capped at certain percentages or tied to market indices, or contracts with volume flexibility provisions enabling adjustments if business conditions change substantially.
Structuring Effective Carrier Contracts
Effective carrier contracts go beyond simple rate sheets to address total cost, service commitments, flexibility, and risk allocation. All-in rates that include base freight plus all surcharges and fees (except truly variable items like fuel) provide cost certainty and simplify budgeting, though carriers often resist comprehensive all-in structures. Alternatively, negotiate caps on surcharges—limit peak season surcharges to 10% maximum, cap fuel surcharge formulas, negotiate commitments on notice periods for rate increases. These protections matter as much as base rates.
Service level agreements (SLAs) with meaningful consequences improve reliability. Negotiate guaranteed transit times with compensation provisions for failures exceeding thresholds—if more than 5% of shipments arrive late, carrier provides rate reductions or credits. Define equipment availability commitments to avoid the “sorry, no containers available” problem during high-demand periods. Specify customer service standards including dedicated account management, response time requirements, and proactive communication on shipment issues.
| Negotiation Element | Transactional Approach | Strategic Approach | Value Difference |
|---|---|---|---|
| Rate Structure | Focus only on base freight rate | Negotiate all-in rates or caps on all surcharges; volume tiers; annual escalation limits | 10-20% total cost reduction through comprehensive rate management |
| Service Commitments | Vague “best efforts” service | Defined SLAs with transit time guarantees, equipment availability, compensation for failures | Improved reliability worth 5-10% in reduced expedite costs and customer satisfaction |
| Contract Flexibility | Rigid volume commitments, exit penalties | Flexible volume bands, adjustment provisions for business changes, reasonable exit terms | Risk mitigation and adaptability to market changes |
| Relationship Management | Transactional interactions only | Regular business reviews, joint optimization initiatives, transparent communication | Superior service, proactive problem-solving, innovation access |
| Multi-Year Planning | Annual re-bidding, constant switching | 2-3 year partnerships with performance-based renewals, continuous improvement focus | Deeper carrier investment in your business, better long-term economics |
Operational Efficiency: Doing More with Less
While negotiation delivers immediate rate improvements, operational efficiency improvements often provide greater long-term value by fundamentally changing cost structures. Consolidation strategies, mode and route optimization, packaging engineering, and process improvements can collectively reduce logistics costs 20-40% while improving service—a combination negotiation alone rarely achieves.
Consolidation: The Most Powerful Cost Lever
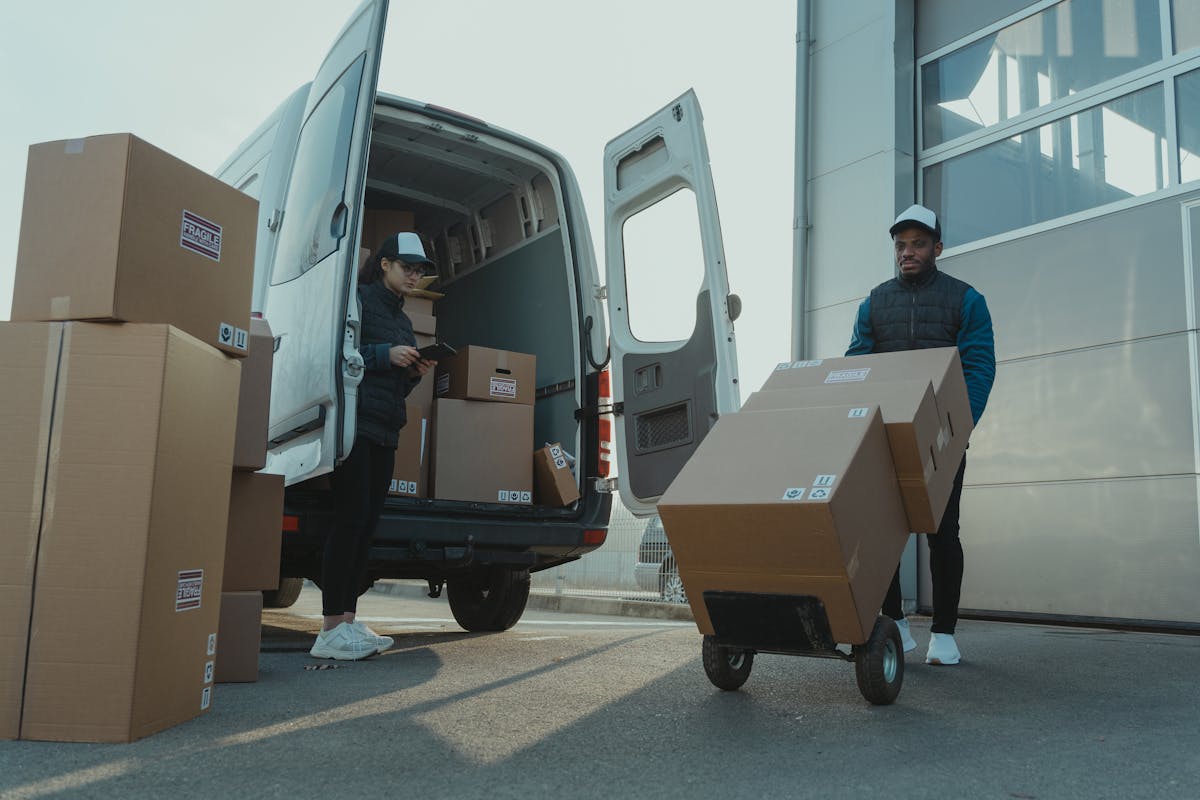
Consolidation economics are compelling: shipping full containers (FCL) costs 30-50% less per cubic meter than LCL (less than container load) shipments. A 40′ container from Vietnam to Los Angeles might cost $3,000; that same volume shipped as LCL could cost $5,000-$6,000. The math becomes even more favorable for air freight where consolidation dramatically reduces per-kg rates. The challenge is finding consolidation opportunities within operational and customer service constraints.
Vietnamese exporters can pursue multiple consolidation strategies simultaneously. Order consolidation combines multiple orders to the same customer or destination into single shipments—instead of shipping weekly LCL as orders come, hold orders for 2-3 weeks and ship full container. Customer consolidation combines shipments to multiple customers in same region into single container shipped to distribution center or consolidation warehouse, then broken down for final delivery (requires sophisticated coordination but delivers substantial savings for exporters serving multiple customers in concentrated geographies). Product consolidation combines different product lines or categories in same shipments when destination and timing align.
The consolidation trade-off is delivery frequency versus cost. More aggressive consolidation saves more money but means longer order-to-delivery cycles and potentially larger inventory requirements at customer sites. Vietnamese furniture exporters serving US retailers typically find optimal consolidation windows of 2-4 weeks—enough time to fill containers without creating unacceptable delivery delays. Fashion and apparel exporters with shorter product life cycles often can’t consolidate as aggressively. Understanding your customers’ inventory management and service requirements determines feasible consolidation strategies.
Mode and Route Optimization
Mode selection dramatically impacts costs but requires sophisticated analysis balancing speed, cost, inventory carrying costs, and service requirements. Ocean freight from Vietnam to US costs roughly $0.08-$0.15 per kg but requires 3-4 weeks transit. Air freight costs $3.50-$5.50 per kg but delivers in 3-5 days. For low-value, bulky products, ocean is obvious choice. For high-value, time-sensitive products, air freight’s speed justifies premium. The interesting cases are in between—products where total landed cost analysis considering inventory carrying costs, obsolescence risk, and customer service value reveals optimal mode may differ from obvious choice.
Route optimization provides cost savings without mode changes. Vietnamese exporters shipping to US East Coast can route through West Coast ports (LA/Long Beach, Oakland, Seattle/Tacoma) with truck or rail to final destinations, or use all-water routes through Panama Canal directly to East Coast ports. West Coast routing typically offers lower ocean freight rates and more sailing frequency but adds inland trucking costs. All-water routes cost more for ocean leg but eliminate expensive transcontinental trucking. Optimal choice depends on specific origin-destination pairs, volumes, and timing requirements. See our Sea Freight vs Air Freight Complete Comparison Guidefor comprehensive mode selection frameworks.
Technology and Data: Enabling Continuous Optimization
Technology investments in transportation management systems (TMS), warehouse management systems (WMS), and analytics platforms enable optimization impossible through manual processes. TMS platforms automate rate shopping across carriers ensuring lowest-cost option for each shipment, optimize load consolidation and routing, and provide comprehensive freight spend analytics revealing optimization opportunities. For Vietnamese exporters spending $500K+ annually on logistics, TMS investment typically delivers 5-15% cost reduction paying for the platform within 12-18 months.
The real value of technology isn’t just automation but visibility and analytics. Real-time shipment tracking enables proactive exception management reducing expedite costs and customer issues. Comprehensive spend analytics reveal patterns invisible without systematic data: which lanes are running above budget, which carriers underperform, which products or customers drive disproportionate costs, which consolidation opportunities exist. Vietnamese exporters operating without these insights make decisions partially blind; those with robust data and analytics optimize continuously based on facts rather than assumptions.
When Technology Investment Makes Sense
Technology isn’t always the answer—implementation costs, change management challenges, and ongoing maintenance create overhead that doesn’t justify itself for smaller operations. As rough guidelines, TMS investment makes sense for companies spending $500K+ annually on transportation with reasonable volume complexity (multiple lanes, carriers, modes). WMS justifies itself for operations handling 1,000+ orders monthly or managing 5,000+ SKUs in warehouses. For smaller operations, leveraging freight forwarders’ technology platforms or simple cloud-based tools provides better economics than enterprise systems.
When evaluating technology investments, calculate comprehensive ROI including both hard savings (freight cost reductions, labor savings) and soft benefits (improved visibility, better customer service, reduced errors). Implementation costs include software licensing or SaaS fees, integration with existing systems (ERP, accounting, WMS), data migration, training, and change management. Factor 6-12 months for implementation and user adoption—don’t expect immediate results. Done properly with realistic expectations and adequate implementation support, technology investments deliver substantial ongoing value for operations of sufficient scale and complexity.
Financial Planning and Performance Management
Strategic cost optimization requires disciplined financial planning and performance management. Develop detailed logistics budgets based on realistic volume forecasts, current rate structures, anticipated surcharges, and historical patterns. Break budgets down by cost category, lane, customer segment, or product line enabling granular tracking and accountability. Include 5-10% contingency for rate volatility and unexpected surcharges—logistics costs fluctuate more than most expense categories.
Track actual performance against budget monthly with variance analysis identifying and explaining significant differences. Are variances due to volume changes (more or less shipment activity than planned), rate changes (carrier rate increases, surcharge spikes), or mix shifts (different products, lanes, or modes than anticipated)? Understanding variance sources enables appropriate responses: volume variances may be acceptable if aligned with business growth, rate variances require renegotiation or carrier changes, mix variances suggest need for operational adjustments or customer discussions about order patterns.
Key Performance Indicators for Cost Management
Define and track KPIs providing leading indicators of cost performance. Cost per unit shipped normalizes for volume changes revealing efficiency trends. Cost as percentage of revenue tracks leverage—improving leverage means logistics costs growing slower than revenue. On-time delivery percentage and shipment damage rates correlate with cost efficiency—poor service metrics often indicate either excessive cost cutting (cheapest carriers underperform) or operational inefficiencies requiring attention. Container utilization percentage reveals consolidation effectiveness—consistently low utilization suggests opportunities for better consolidation strategies.
Important:Cost optimization targets and improvement potential vary significantly by business model, product characteristics, current cost structure, volume levels, service requirements, and operational sophistication. Improvement percentages cited above represent patterns observed across typical Vietnamese export operations as of November 2025 but individual results vary widely. Some operations already optimized will see smaller improvements; operations with significant inefficiencies may exceed these ranges. Technology ROI calculations must include comprehensive implementation costs and realistic adoption timelines—promised savings don’t materialize without adequate implementation investment and change management. Last updated: November 2025
Continuous Improvement: Building Optimization Discipline
Cost optimization isn’t one-time project but ongoing discipline requiring continuous attention, measurement, and improvement. Markets change, business evolves, new opportunities emerge, and yesterday’s optimal solutions become outdated. The most successful Vietnamese exporters build optimization into their operating rhythms through quarterly carrier performance reviews, annual RFP cycles for major spend categories, regular benchmarking against industry standards and internal targets, and continuous process improvement initiatives attacking inefficiencies systematically.
Freight audit services provide valuable continuous improvement mechanism. Third-party freight audit firms review carrier invoices for accuracy, recovering overcharges and billing errors that slip through accounts payable. Typical freight audits recover 3-8% of freight spend—enough to pay for the service (most work on contingency) and deliver net savings. Beyond overcharge recovery, freight audits reveal patterns: carriers consistently making certain errors, surcharges applied incorrectly, rate increases not aligned with contracts. These insights enable corrective actions preventing future overcharges.
Building Cost-Conscious Culture
Technology, processes, and negotiations deliver results, but culture sustains them. Organizations where everyone understands cost drivers and feels responsibility for optimization achieve superior results compared to those where logistics costs are “somebody else’s problem.” Vietnamese exporters building cost-conscious cultures educate staff across functions about logistics cost components and drivers, involve operations teams in improvement initiatives rather than imposing solutions top-down, celebrate and share cost-saving innovations, and align incentives with optimization goals (consider bonus structures rewarding cost efficiency alongside revenue and quality metrics).
Cross-functional collaboration proves particularly valuable. Product development teams designing more compact products or right-sized packaging can dramatically improve logistics economics. Sales teams understanding cost-to-serve can steer customers toward more economical order patterns. Finance teams providing detailed cost visibility enable optimization impossible with aggregated data. When these functions work in concert rather than silos, optimization opportunities multiply.
Ready to Optimize Logistics Costs Strategically?
Logistics cost optimization represents one of the highest-return investments Vietnamese exporters can make. Unlike many business improvement initiatives requiring major capital investment or years to deliver results, logistics optimization delivers measurable savings within months while building capabilities providing ongoing value. The key is approaching optimization strategically—comprehensive analysis revealing where money goes and why, professional negotiations capturing fair value from carriers and service providers, operational improvements fundamentally changing cost structures, technology enabling continuous optimization, and disciplined performance management sustaining improvements.
The Vietnamese exporters who master cost optimization don’t just save money—they build competitive advantages enabling growth. You can price more aggressively than competitors with higher cost structures. You can invest savings in service improvements or market expansion. You can weather market volatility and price pressure that defeats less efficient competitors. And you develop organizational capabilities in analytical rigor, operational excellence, and continuous improvement that deliver value far beyond logistics into every aspect of your business.
Professional Cost Optimization Support
Logistics cost optimization involves complex analytical, operational, commercial, and strategic considerations specific to your business model, shipping patterns, volumes, and service requirements.Effective optimization requires comprehensive cost analysis, strategic sourcing expertise, operational improvement capabilities, technology knowledge, and financial planning discipline.
Many Vietnamese exporters lack internal expertise or bandwidth to execute sophisticated optimization initiatives while maintaining daily operations. Professional logistics consultants, freight forwarders with analytical capabilities, supply chain advisors, and technology specialists provide essential support designing and implementing optimization strategies delivering measurable, sustainable results.
Contact our teamto discuss your logistics cost optimization goals and connect with qualified consultants and service providers who can help you analyze costs comprehensively, develop optimization strategies, negotiate with carriers, implement operational improvements, and build sustainable cost management capabilities.
Related Resources for Logistics Cost Optimization:
Mode and Route Optimization:
- Sea Freight vs Air Freight Complete Comparison Guide: Comprehensive mode selection analysis balancing cost and service
- LCL Shipping Explained: Cost-Effective Solutions for Small Shipments: Understanding LCL economics and when it makes sense
- How Air Cargo Consolidation Can Save Costs for Vietnamese Exporters: Air freight consolidation strategies
Operational Efficiency:
- Multi-Modal Transportation Integration Strategies: Optimizing mode combinations for cost and service
- Choosing the Right Warehousing Solution: Warehouse cost optimization strategies
- Optimizing Last-Mile Delivery in Vietnam: Final-mile cost management
Strategic Planning:
- Duty and Tax Optimization Strategic Planning: FTA utilization and customs cost reduction
- International Shipping Risk Management: Balancing cost optimization with risk management
- The Strategic Value of Professional Logistics Consulting: When to engage external optimization expertise
Technology and Visibility:
- Logistics Technology Solutions Selection and Implementation: TMS, WMS, and analytics platforms
- Supply Chain Visibility Technology Solutions Guide: Visibility enabling cost control
Professional Services:
- Logistics Consulting: Cost analysis, optimization strategy development, implementation support
- Logistics Services: Cost-effective freight forwarding and logistics solutions
- Contact Us: Connect with logistics cost optimization specialists